Cyclistic-Case-Study
Cyclistic Bike-Share Behaviour Analysis
Analysed 5.4 million ride records in Google BigQuery (cloud data warehouse) using analytical SQL to identify behavioural differences between casual riders and annual members.
Designed operational marketing interventions and a measurable validation plan to increase membership conversion and revenue stability.
Live project: https://m77rahman.github.io/Cyclistic-Case-Study/
Full report: report/cyclistic_case_study.pdf
Business Problem
Cyclistic’s profitability depends on annual members, but a large portion of usage comes from casual riders.
The objective is to understand behavioural differences and determine practical actions that convert casual riders into members.
Data Environment
The dataset was analysed entirely in Google BigQuery, allowing efficient querying of a multi-million-row dataset without local processing.
All aggregation was performed in the warehouse before exporting results for visualisation.
- Platform: Google BigQuery
- Period: 12 months of Divvy trip data
- Records analysed: 5,400,008 rides
Analytical Method
- Queried large datasets using cloud warehouse SQL
- Cleaned invalid ride records
- Engineered behavioural time features
- Aggregated ride behaviour by rider type
- Interpreted patterns into operational decisions
Query Optimisation Approach
To minimise scan cost and improve performance:
- selected only required columns
- filtered invalid rides before aggregation
- used staged tables instead of repeated full scans
- exported aggregated summaries only
Headline Results
- Members: 3,484,202 rides (64.52%)
- Casual: 1,915,806 rides (35.48%)
- Average ride length: Casual 19.41 min vs Member 11.68 min
Behaviour Patterns
| Behaviour | Members | Casual Riders |
|---|---|---|
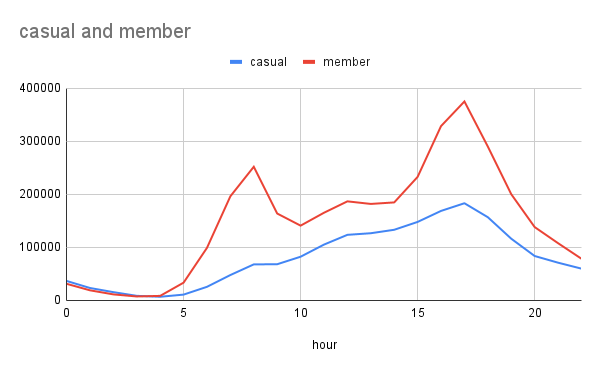
| Time of day | Commute peaks (08:00 & 17:00) | Afternoon usage |
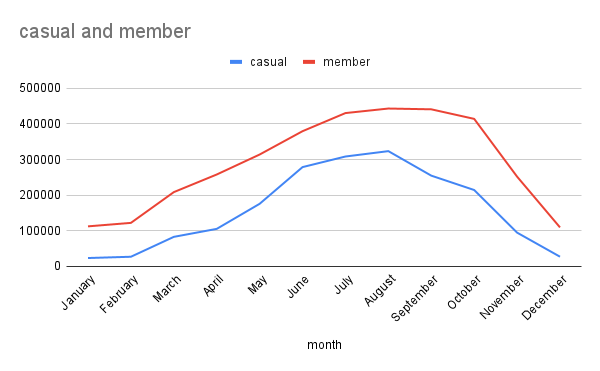
| Seasonality | Stable year-round | Summer dependent |
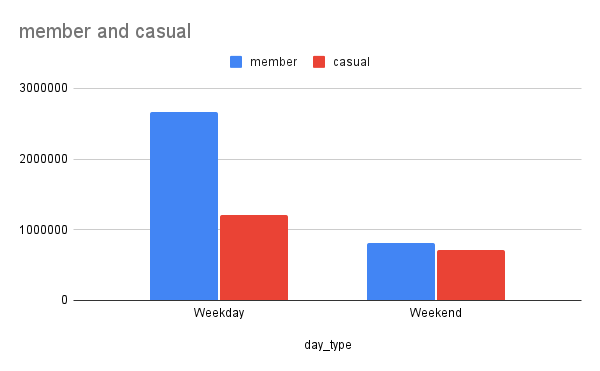
| Week pattern | Weekday dominant | Weekend heavy |
| Purpose | Transportation | Leisure |
Key Findings
Members commute → target 07:30–09:30 messaging
Summer is the conversion window → run May–Aug offers
Weekend riders are conversion candidates → shift to weekday habits
Business Interpretation
Cyclistic serves two behavioural segments:
Members
- routine transportation users
- predictable commuting behaviour
- stable demand
Casual riders
- leisure users
- weather-dependent usage
- occasional trips
Therefore the opportunity is not attracting new users but converting existing engaged users into repeat customers.
Operational Plan
1. Summer conversion offer
Trigger: after a casual rider completes their 2nd ride
Channel: mobile push notification
Timing: May–August, 10:00–16:00
2. Commute positioning
Channel: in-app banner + station display
Timing: 07:30–09:30 and 16:30–18:30
3. Weekend rider activation
Trigger: 3 weekend rides within 30 days
Offer: discounted first-month membership
Estimated Business Impact
Casual riders completed ~1.9M rides annually.
If 5% convert to membership: ~95,000 new members → increased recurring revenue and reduced seasonal volatility.
Success Metrics
Primary KPI
- Weekly casual → member conversion rate
Supporting KPIs
- % targeted riders converting
- Member rides per week after conversion
- Weekday ride share change
Validation Plan
Campaigns should be evaluated using controlled experiments:
- Compare targeted riders vs similar non-targeted riders
- Run campaigns during identical seasonal periods
- Measure uplift above baseline conversion rate
Success is defined as sustained conversion and increased weekday usage after intervention.
Analytical Limitations
The dataset captures behaviour but not context:
- Weather conditions unavailable
- Tourist vs resident status unknown
- Pricing sensitivity not included
- Station geography not analysed
- Trip purpose inferred rather than observed
Recommendations therefore require experimental validation before full rollout.
Reproducibility
Dataset: 12 months Divvy trip data
Tables created:
- trips_raw
- cleaned_trips
- featured_trips
- aggregated summaries
Cleaning rules:
- removed null timestamps
- removed rides < 1 min or > 24 hours
SQL workflow:
- staging
- cleaning
- feature engineering
- aggregation
- business queries
Repository Structure
- report/cyclistic_case_study.pdf — full report
- images/ — charts
- sql/01_cleaning.sql
- sql/02_feature_engineering.sql
- sql/03_aggregation.sql
- sql/04_business_questions.sql